
Which states have the most and the longest power outages?
 | August 1, 2025 | 5 min read |
Which states have the most and the longest power outages?
Power outages are an unfortunate reality that many Americans face throughout the year. This is especially true for those living in areas of the U.S. that regularly experience severe weather, as strong winds and heavy rainfall are leading causes of power outages. According to U.S. Energy Information Administration (EIA) data, certain states do tend to experience power outages more often and for longer durations than others, so the Ooma research team decided to dig into this data, examining the EIA’s Annual Electric Industry Reports between 2019 and 2023 to determine which states had the most frequent and longest power outages. Explore the graphic below to see where Americans are left in the dark the most.
Which state has the most power outages each year?
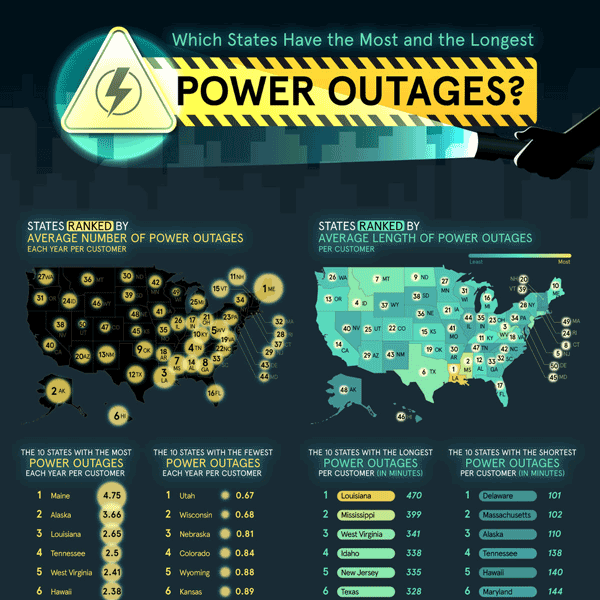
Maine has the highest number of power outages annually, averaging 4.75 outages per customer for the state’s 845,218 customers. Maine also experiences the most total minutes of power outages each year, averaging 1,386 minutes per customer, or just more than 23 hours.
Why does Maine have such a high rate of power outages? Fittingly known as the Pine Tree State, Maine is the most heavily forested state in the nation, and falling trees and branches are a common cause of power outages. This issue is compounded by Maine’s aging infrastructure, which spans the state’s many rural areas, and severe snow and ice storms that batter the state during the winter.
The 10 states with the most power outages each year per customer
- Maine: 4.75
- Alaska: 3.66
- Louisiana: 2.65
- Tennessee: 2.50
- West Virginia: 2.41
- Hawaii: 2.38
- Mississippi: 2.13
- Georgia: 2.01
- Oklahoma: 1.98
- Kentucky: 1.97
Which state has the fewest power outages each year?
Utah narrowly surpassed Wisconsin for the top spot with an impressively low rate of 0.67 power outages per customer annually, while Wisconsin’s rate was slightly higher at 0.68 outages. Several factors have led to Utah’s minimal power outages, including a well-maintained power grid and a milder climate with less severe weather.
The 10 states with the fewest power outages each year per customer
- Utah: 0.67
- Wisconsin: 0.68
- Nebraska: 0.81
- Colorado: 0.84
- Wyoming: 0.88
- Kansas: 0.89
- Maryland: 0.91
- Delaware: 0.95
- Minnesota: 1.04
- Iowa: 1.05
Which state has the longest power outages?
Louisiana has the longest power outages in the U.S., with an average of 470 minutes per outage per customer. That’s almost eight hours without access to electricity per outage. The lengthy average duration of Louisiana’s power outages can be attributed to severe weather from hurricanes and tropical storms along the Gulf Coast. Over the five years of data collected in the EIA’s reports, Louisiana experienced the longest outages in 2021, which were attributed to the destruction caused by Hurricane Ida. The average power outage in the state in 2021 was 1,297 minutes per customer, or 21.6 hours. Hurricane Ida was the second most damaging hurricane on record for Louisiana; only 2005’s Hurricane Katrina was worse.
In addition to Louisiana, other states along the Gulf Coast also face long wait times for power restoration. Mississippi’s power outages are the second longest, averaging 399 minutes, while Texas’s outages rank sixth, averaging 328 minutes. When powerful storms hit these coastal states, it can take utility companies several days to restore power to affected customers. Over the past five years, Texas customers have experienced hundreds of outages, often attributed to the aging Texas power grid being among the worst in the U.S.
The 10 states with the longest power outages per customer (in minutes)
- Louisiana: 470
- Mississippi: 399
- West Virginia: 341
- Idaho: 338
- New Jersey: 335
- Texas: 328
- Montana: 322
- Connecticut: 310
- North Dakota: 304
- Maine: 291
Which state has the shortest power outages?
Despite being a coastal state that’s sometimes affected by hurricanes, Delaware experiences the shortest power outages in the country. On average, power is restored in Delaware more than four times faster than in Louisiana after an outage. This may be due to Delaware’s small size, which can make it easier for crews to respond and fix issues. Another factor could be its relatively modern infrastructure and strong grid connections, which may help restore power more efficiently after an outage.
The 10 states with the shortest power outages per customer (in minutes)
- Delaware: 101
- Massachusetts: 102
- Alaska: 110
- Tennessee: 138
- Hawaii: 140
- Maryland: 144
- Illinois: 153
- New Mexico: 155
- North Carolina: 158
- Missouri: 165
What happens to emergency phone lines during a power outage?
One area of concern during a power outage is how phone lines will be affected if help is needed. Landlines, or “plain old telephone service” (POTS) lines, that rely on a copper network will continue to function without electricity, but what happens when these copper phone lines are phased out? Phone providers plan to decommission large portions of their copper networks in the coming years to modernize infrastructure and offer more advanced services. One solution for businesses is digitally upgrading landlines with a POTS line replacement like Ooma AirDial. This hassle-free, all-in-one solution addresses your POTS replacement needs with one provider. Learn more about the many benefits of digitally upgrading your traditional landline with our list of POTS line replacement resources.
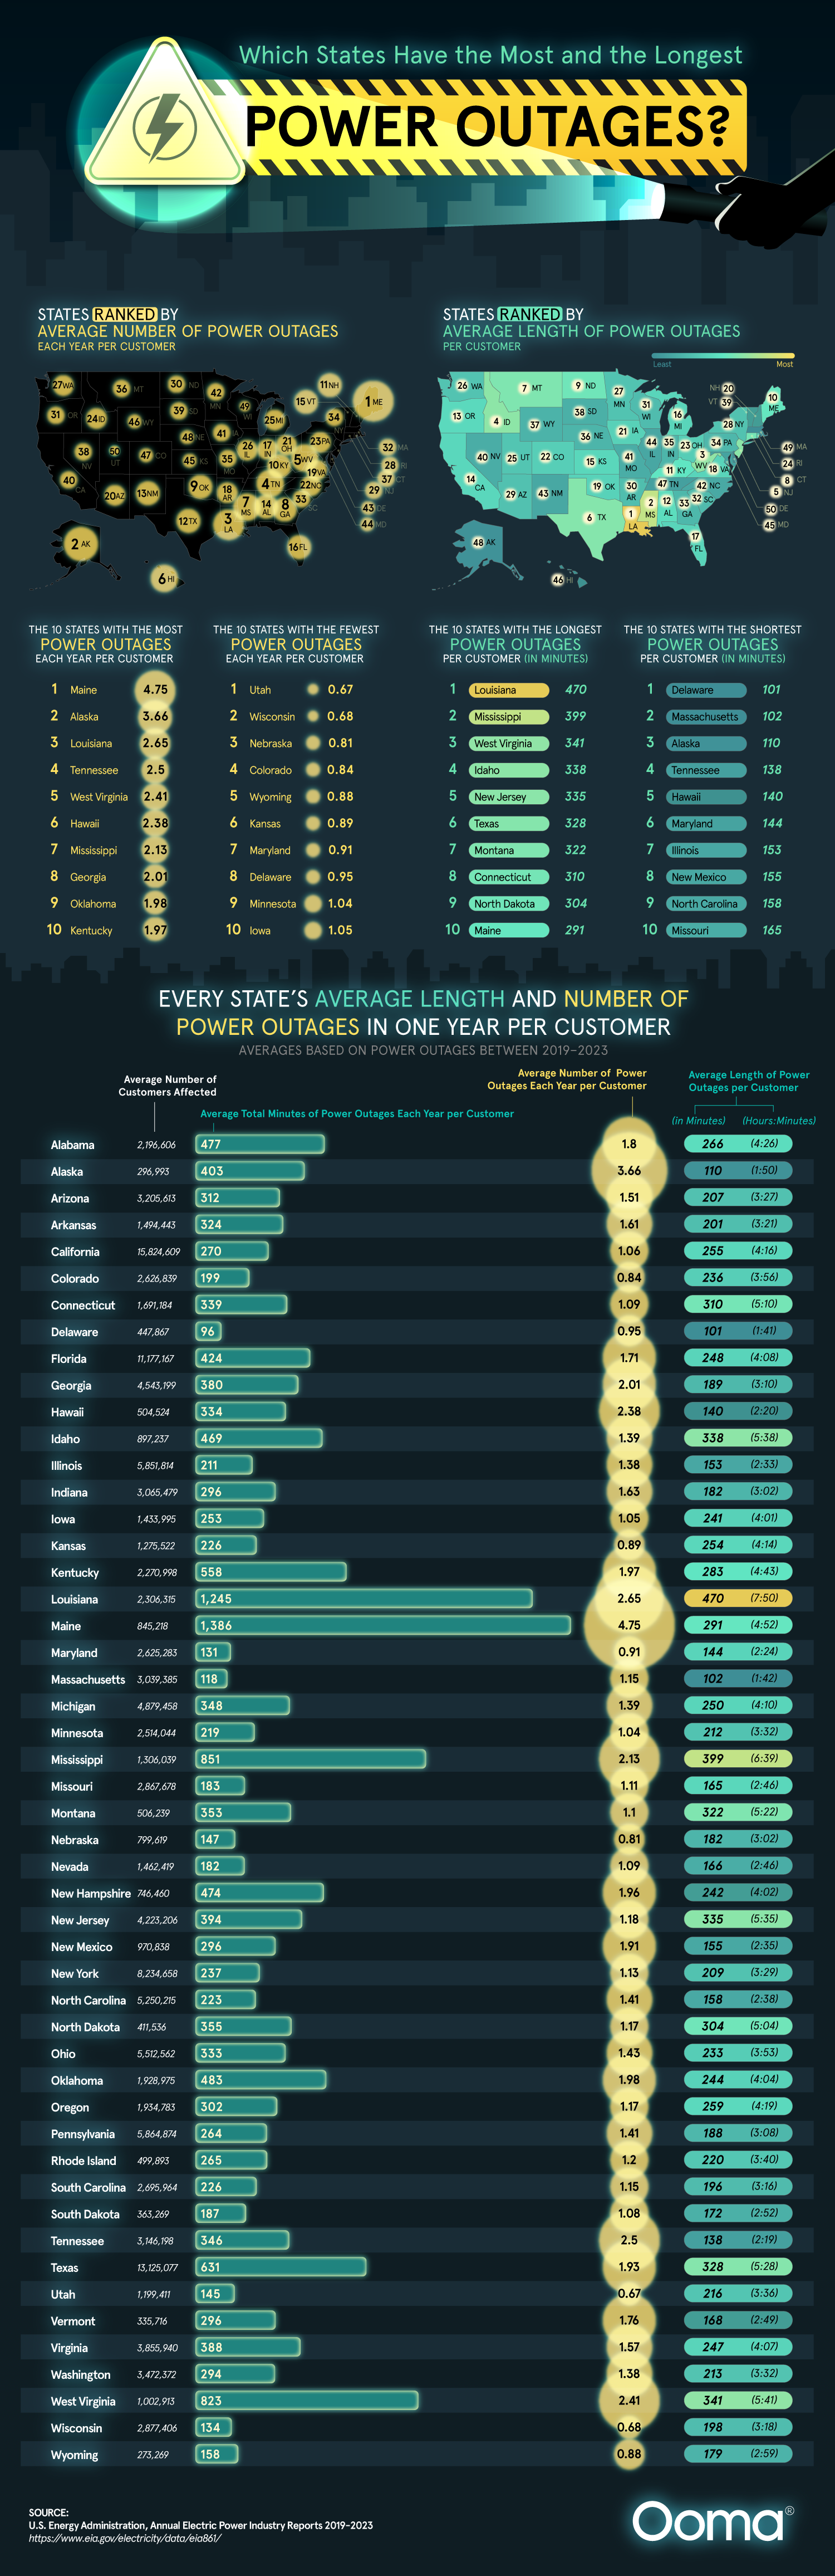
Every state’s average length and number of power outages in one year per customer
Averages based on power outage data from 2019–23
| State | Number of customers | Average total minutes of power outages each year per customer | Average number of power outages each year per customer | Average length of power outages per customer (in minutes) | Average length of power outages per customer (in hours and minutes) |
| Alabama | 2,587,680 | 477 | 1.80 | 266 | (4:26) |
| Alaska | 468,174 | 403 | 3.66 | 110 | (1:50) |
| Arizona | 6,583,562 | 312 | 1.51 | 207 | (3:27) |
| Arkansas | 2,915,242 | 324 | 1.61 | 201 | (3:21) |
| California | 31,130,810 | 270 | 1.06 | 255 | (4:16) |
| Colorado | 5,291,277 | 199 | 0.84 | 236 | (3:56) |
| Connecticut | 3,058,096 | 339 | 1.09 | 310 | (5:10) |
| Delaware | 933,161 | 96 | 0.95 | 101 | (1:41) |
| Florida | 21,310,765 | 424 | 1.71 | 248 | (4:08) |
| Georgia | 9,462,683 | 380 | 2.01 | 189 | (3:10) |
| Hawaii | 541,799 | 334 | 2.38 | 140 | (2:20) |
| Idaho | 1,874,173 | 469 | 1.39 | 338 | (5:38) |
| Illinois | 11,694,429 | 211 | 1.38 | 153 | (2:33) |
| Indiana | 5,948,927 | 296 | 1.63 | 182 | (3:02) |
| Iowa | 2,340,418 | 253 | 1.05 | 241 | (4:01) |
| Kansas | 2,563,183 | 226 | 0.89 | 254 | (4:14) |
| Kentucky | 4,529,383 | 558 | 1.97 | 283 | (4:43) |
| Louisiana | 4,074,389 | 1245 | 2.65 | 470 | (7:50) |
| Maine | 1,698,966 | 1386 | 4.75 | 291 | (4:52) |
| Maryland | 5,336,325 | 131 | 0.91 | 144 | (2:24) |
| Massachusetts | 5,819,717 | 118 | 1.15 | 102 | (1:42) |
| Michigan | 9,695,023 | 348 | 1.39 | 250 | (4:10) |
| Minnesota | 5,031,836 | 219 | 1.04 | 212 | (3:32) |
| Mississippi | 2,425,335 | 851 | 2.13 | 399 | (6:39) |
| Missouri | 5,677,322 | 183 | 1.11 | 165 | (2:46) |
| Montana | 971,394 | 353 | 1.10 | 322 | (5:22) |
| Nebraska | 1,570,477 | 147 | 0.81 | 182 | (3:02) |
| Nevada | 3,013,066 | 182 | 1.09 | 166 | (2:46) |
| New Hampshire | 1,428,192 | 474 | 1.96 | 242 | (4:02) |
| New Jersey | 8,522,421 | 394 | 1.18 | 335 | (5:35) |
| New Mexico | 1,900,767 | 296 | 1.91 | 155 | (2:35) |
| New York | 10,085,372 | 237 | 1.13 | 209 | (3:29) |
| North Carolina | 10,538,573 | 223 | 1.41 | 158 | (2:38) |
| North Dakota | 733,990 | 355 | 1.17 | 304 | (5:04) |
| Ohio | 11,102,224 | 333 | 1.43 | 233 | (3:53) |
| Oklahoma | 2,965,919 | 483 | 1.98 | 244 | (4:04) |
| Oregon | 3,814,663 | 302 | 1.17 | 259 | (4:19) |
| Pennsylvania | 11,194,192 | 264 | 1.41 | 188 | (3:08) |
| Rhode Island | 1,006,974 | 265 | 1.20 | 220 | (3:40) |
| South Carolina | 5,507,753 | 226 | 1.15 | 196 | (3:16) |
| South Dakota | 722,079 | 187 | 1.08 | 172 | (2:52) |
| Tennessee | 5,832,387 | 346 | 2.50 | 138 | (2:19) |
| Texas | 22,882,543 | 631 | 1.93 | 328 | (5:28) |
| Utah | 2,429,731 | 145 | 0.67 | 216 | (3:36) |
| Vermont | 375,414 | 296 | 1.76 | 168 | (2:49) |
| Virginia | 5,180,725 | 388 | 1.57 | 247 | (4:07) |
| Washington | 6,865,867 | 294 | 1.38 | 213 | (3:32) |
| West Virginia | 2,008,496 | 823 | 2.41 | 341 | (5:41) |
| Wisconsin | 5,319,275 | 134 | 0.68 | 198 | (3:18) |
| Wyoming | 502,129 | 158 | 0.88 | 179 | (2:59) |
Source:
U.S. Energy Administration, Annual Electric Power Industry Reports 2019-2023
Husain Sumra is a former journalist who reported on the biggest companies in tech, from Apple to Amazon, covering cloud services, consumer technology and communication solutions. His journalism background has helped him bring a customer-first approach to content marketing, creating pieces of content aimed at helping people.