Which industries contribute most to the United States’ GDP?
 | July 31, 2026 | 7 min read |

The United States economy is enormous, generating trillions of dollars in economic activity each year and encompassing a wide range of industries of global significance. From manufacturing and finance to technology and entertainment, few countries operate on a comparable scale, and even fewer boast such a diverse economy. In fact, the total U.S. GDP for 2024 exceeded $29 trillion, more than the combined economies of China, Germany and Japan.
The substantial diversity of the American economy is part of what makes it such a powerhouse. Entire regions of the country have been built around specific industries, such as Wall Street finance in New York, agriculture in the upper Midwest and the big tech companies of Silicon Valley. Together, they all contribute to the GDP.
Because the United States relies on so many major industries, Ooma looked at the data from the Bureau of Economic Analysis to determine which sectors contribute the most to U.S. GDP and why they continue to dominate the American economy.
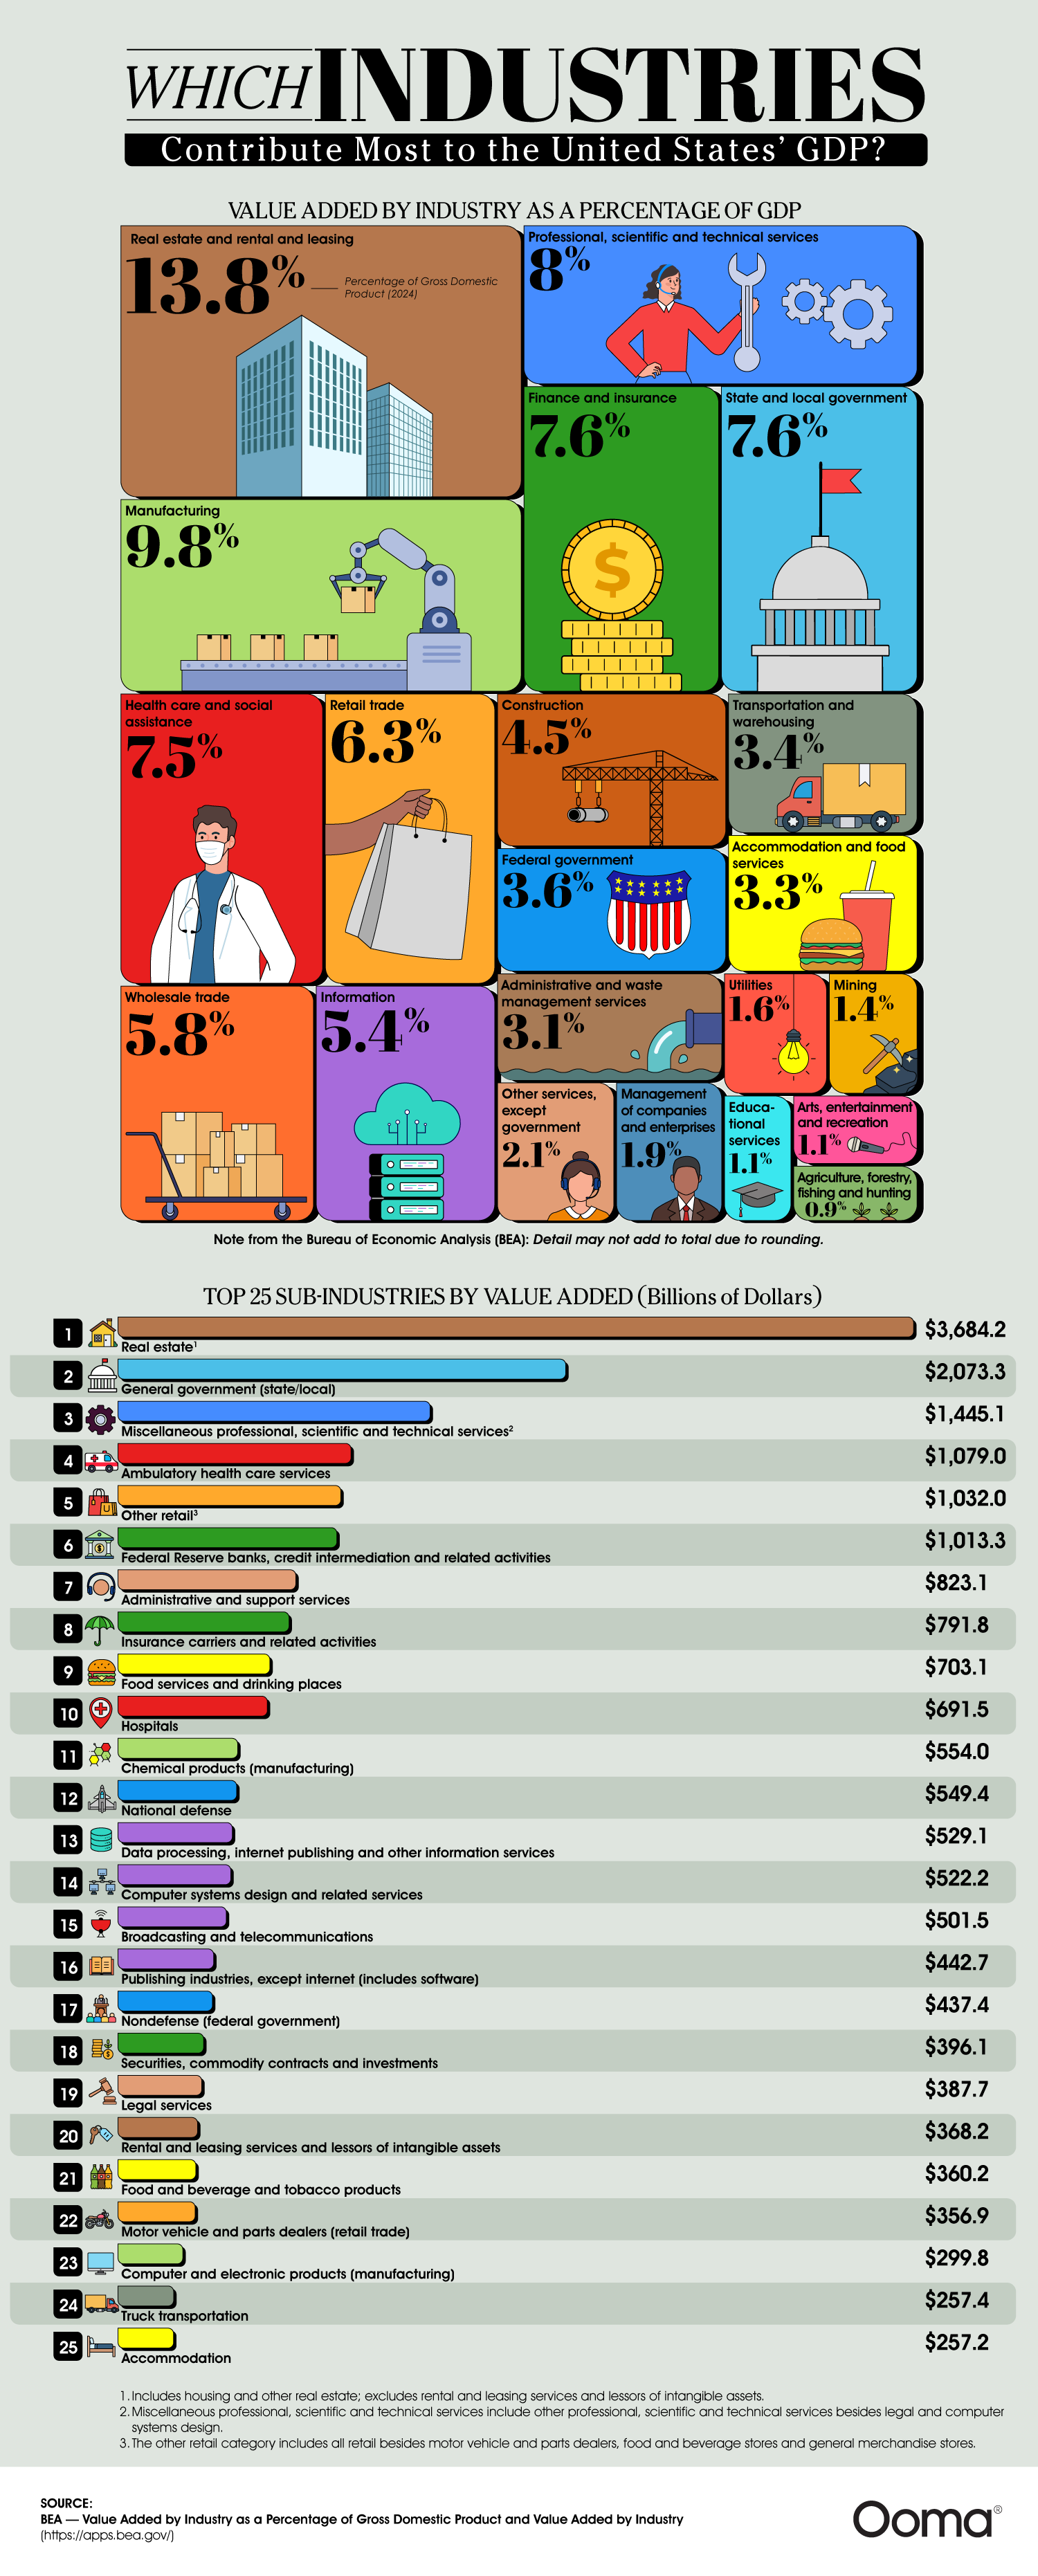
Share this infographic
Copy and paste the code below to embed this infographic on your website.
An overview of GDP
GDP stands for gross domestic product, and in simple terms, it measures the size of the economy. All goods and services produced within a country in a given year contribute to its GDP, and it’s a metric often used to gauge the overall health of an economy. However, because of the scale of the numbers we’re usually dealing with, breaking down GDP by industry can give us a much clearer picture of which areas are producing the most value and growing.
The Bureau of Economic Analysis, or BEA, breaks down the U.S. GDP by industry to show each sector’s “value added” contribution. Value added is essentially what each industry contributes after subtracting the cost of the raw materials needed to produce a good or service. A car manufacturer, for example, will need to buy materials like steel, electronics and rubber from suppliers. Therefore, the value added is the difference between the final car’s price and those costs. When you combine these calculations across every industry in the country, you end up with the GDP.
Which industries contribute the most to the U.S. GDP?
-
Real estate and rental and leasing — 13.8%
While American manufacturing gets a lot of press, real estate is actually the largest industry in America, accounting for 13.8% of U.S. GDP.
At the sub-industry level, real estate alone contributed $3.684 trillion in value added in 2024, the highest of any sub-industry across the entire economy. Companies like CBRE Group, Equity Residential, Prologis and Simon Property Group are just a fraction of the massive commercial real estate ecosystem, yet they collectively represent hundreds of billions in market value. Whenever Americans buy homes, pay property taxes, rent apartments or lease commercial space, those transactions all contribute to the value of this market.
Part of the scale of this sector is also due to the U.S. having a massive rental market. As homeownership costs have risen significantly over the past decade, more Americans have shifted toward renting, which has, in turn, propped up the rental and leasing side of this category.
-
Manufacturing — 9.8%
Manufacturing contributes 9.8% to U.S. GDP, making it the second most profitable industry in the country. The U.S. remains one of the world’s top manufacturing nations, even though employment in the sector has declined significantly due to automation and overseas production.
Chemical products and computer and electronic products are among the highest-value manufacturing sub-industries, contributing $554 billion and $299.8 billion, respectively, thanks to companies like Tesla, Intel, General Motors and Dow.
-
Professional, scientific and technical services — 8.0%
Professional, scientific and technical services are now one of the largest industries in the United States, accounting for 8% of the economy and reflecting an economic shift toward knowledge-based skills over the last few decades. Legal services, consulting, software development, engineering and specialized technical work by major firms like Accenture, Deloitte, Kirkland & Ellis and IBM demonstrate that American expertise in STEM-related skills is highly valued worldwide.
-
Finance and insurance — 7.6%
Finance and insurance contribute 7.6% to the U.S. GDP. Federal Reserve banks, credit intermediation and related activities generated $1.013 trillion in value added, while insurance carriers added another $791.8 billion, followed by $396.1 billion from securities, commodity contracts and investments.
Firms such as JPMorgan Chase, Goldman Sachs, Berkshire Hathaway and Visa play a major role in the U.S. financial system, influencing lending and investment, insurance markets, consumer spending and even global economies.
-
Health care and social assistance — 7.5%
Health care and social assistance account for 7.5% of GDP, a share that reflects both the sector’s essential role and the unprecedentedly high cost of medical care in the United States.
Ambulatory health care services generated $1.079 trillion in value added, and hospitals added another $691.5 billion.
The United States spends more on health care per capita than any other developed nation. While that has led to numerous policy debates among Americans, it also makes health care one of the most profitable industries in the U.S. Organizations like UnitedHealth Group, HCA Healthcare and Kaiser Permanente are among the largest employers in the country, and the sector’s workforce is expected to grow as the American population ages.
Other significant contributors to the U.S. GDP
Beyond the top five industries by GDP in the U.S., several other major industries deserve recognition. Retail trade contributes 6.3%, reflecting the immense size of the American consumer market.
Meanwhile, the information sector, an influential and growing segment that includes companies like Google, Meta and Amazon Web Services, accounted for 5.4%. Within the space, data processing, internet publishing and other information services contributed $529.1 billion. Broadcasting and telecommunications added $501.5 billion, and publishing industries, including software, contributed $442.7 billion.
Construction rounds out the top ten at 4.5%, largely due to its symbiotic relationship with the real estate sector. When the housing market heats up, construction follows, meaning the United States’ largest industry by GDP also feeds its ninth-largest industry.
Why these industries matter for businesses today
Looking at GDP by industry helps us understand what the American economy depends on to keep growing. Real estate leads the pack, but manufacturing, finance, health care, professional services and retail all play massive roles in contributing to the world’s largest economy.
For businesses that operate in these major economic markets, communication is essential. Whether you are managing properties, running a medical office, coordinating logistics or serving customers across multiple locations, reliable communication drives productivity and growth.
Ooma provides communication solutions built for modern businesses that need flexibility, clarity and dependable service without unnecessary complexity. If your team is ready for smarter business communication, contact Ooma today to see how the right phone system can support the industry you are helping advance.
Which industries drive the U.S. economy the most?
Value added by industry as a percentage of GDP
| Industry | Percentage of GDP (2024) |
|---|---|
| Real estate and rental and leasing | 13.8% |
| Manufacturing | 9.8% |
| Professional, scientific and technical services | 8.0% |
| Finance and insurance | 7.6% |
| State and local government | 7.6% |
| Health care and social assistance | 7.5% |
| Retail trade | 6.3% |
| Wholesale trade | 5.8% |
| Information | 5.4% |
| Construction | 4.5% |
| Federal government | 3.6% |
| Transportation and warehousing | 3.4% |
| Accommodation and food services | 3.3% |
| Administrative and waste management services | 3.1% |
| Other services, except government | 2.1% |
| Management of companies and enterprises | 1.9% |
| Utilities | 1.6% |
| Mining | 1.4% |
| Educational services | 1.1% |
| Arts, entertainment and recreation | 1.1% |
| Agriculture, forestry, fishing and hunting | 0.9% |
Note from the Bureau of Economic Analysis (BEA): Detail may not add to total due to rounding.
Top 25 sub-industries by value added (billions of dollars)
| Sub-industry | Billions of dollars (2024) |
|---|---|
| Real estate1 | $3,684.2 |
| General government (state/local) | $2,073.3 |
| Miscellaneous professional, scientific and technical services2 | $1,445.1 |
| Ambulatory health care services | $1,079 |
| Other retail3 | $1,032 |
| Federal Reserve banks, credit intermediation and related activities | $1,013.3 |
| Administrative and support services | $823.1 |
| Insurance carriers and related activities | $791.8 |
| Food services and drinking places | $703.1 |
| Hospitals | $691.5 |
| Chemical products (manufacturing) | $554.0 |
| National defense | $549.4 |
| Data processing, internet publishing and other information services | $529.1 |
| Computer systems design and related services | $522.2 |
| Broadcasting and telecommunications | $501.5 |
| Publishing industries, except internet (includes software) | $442.7 |
| Nondefense (federal government) | $437.4 |
| Securities, commodity contracts and investments | $396.1 |
| Legal services | $387.7 |
| Rental and leasing services and lessors of intangible assets | $368.2 |
| Food and beverage and tobacco products | $360.2 |
| Motor vehicle and parts dealers (retail trade) | $356.9 |
| Computer and electronic products (manufacturing) | $299.8 |
| Truck transportation | $257.4 |
| Accommodation | $257.2 |
1 Includes housing and other real estate; excludes rental and leasing services and lessors of intangible assets.
2 Miscellaneous professional, scientific and technical services include other professional, scientific and technical services besides legal and computer systems design.
3 The other retail category includes all retail besides motor vehicle and parts dealers, food and beverage stores and general merchandise stores.
Source: BEA — Value Added by Industry as a Percentage of Gross Domestic Product and Value Added by Industry
Husain Sumra is a former journalist who reported on the biggest companies in tech, from Apple to Amazon, covering cloud services, consumer technology and communication solutions. His journalism background has helped him bring a customer-first approach to content marketing, creating pieces of content aimed at helping people.