Are new companies more likely to support working from home?
 | July 29, 2025 | 7 min read |
For decades, the usual workday happened on location or in an office. To interact with your coworkers, share ideas and distribute files, you typically needed to see them face to face. For customer-facing roles, you’d have to be on standby to use your employer’s phone system or be physically present to greet customers. However, the workplace has begun to see a monumental shift over the past few years. The necessity of being in an office has declined due to the widespread availability of high-speed internet access and video conferencing platforms. With these changes, employees are starting to push for the freedom that comes with working from home and not having a commute.
As the digital workplace matures and more companies shift toward work-from-home jobs, it stands to reason that not every industry and company is able or willing to adapt. New companies and startups often have the most to gain (or lose) when embracing fresh ideas, but are they leading the charge with the work-from-home movement? The team at Ooma wanted to find out, so today, we put the data to the test to find out who is most likely to let their employees work from home.

Remote work trends post-pandemic
Due to global lockdowns, the shift toward working from home gained massive momentum during the COVID-19 pandemic. Surprisingly, the pandemic started a trend that slowed down only a little after offices reopened. According to remote work statistics from 2023, 35 percent of workers with jobs that can be done remotely were working from home, compared to 38 percent in 2021. Compare this to 2019, when only 23 percent of employees worked from home, and it’s clear that the pandemic sparked a sea change in how we work.
This evolution has spurred growth in work-from-home opportunities across industries, especially in remote customer service jobs and tech-forward sectors.
Pros and cons of working from home
The benefits of allowing employees to stay home can be significant for employers. For example, employers have access to larger pools of talent and have reduced overhead costs thanks to lower office space needs. Additionally, employees who work remotely are often more productive, with reports consistently showing higher engagement among hybrid and fully remote employees compared to their in-office peers.
Still, there are trade-offs for businesses. Managing teams across multiple locations can be complex, particularly if a manager isn’t tech-savvy. Additionally, despite being more engaged, many employees who work remotely experience higher stress levels, and they’re often lonelier. Handling IT security can also present serious challenges. Older businesses tend to be more afraid of security concerns that come with work-from-home models than their younger counterparts, potentially because it’s more difficult to retrofit the appropriate security measures to older systems.
There’s also the simple matter of logistics to consider. Jobs in industries like health care and manufacturing simply can’t be done from home. These businesses say no to remote work because the nature of the job itself doesn’t allow it, a statistic that isn’t influenced by company age.
Who is most likely to allow working from home?
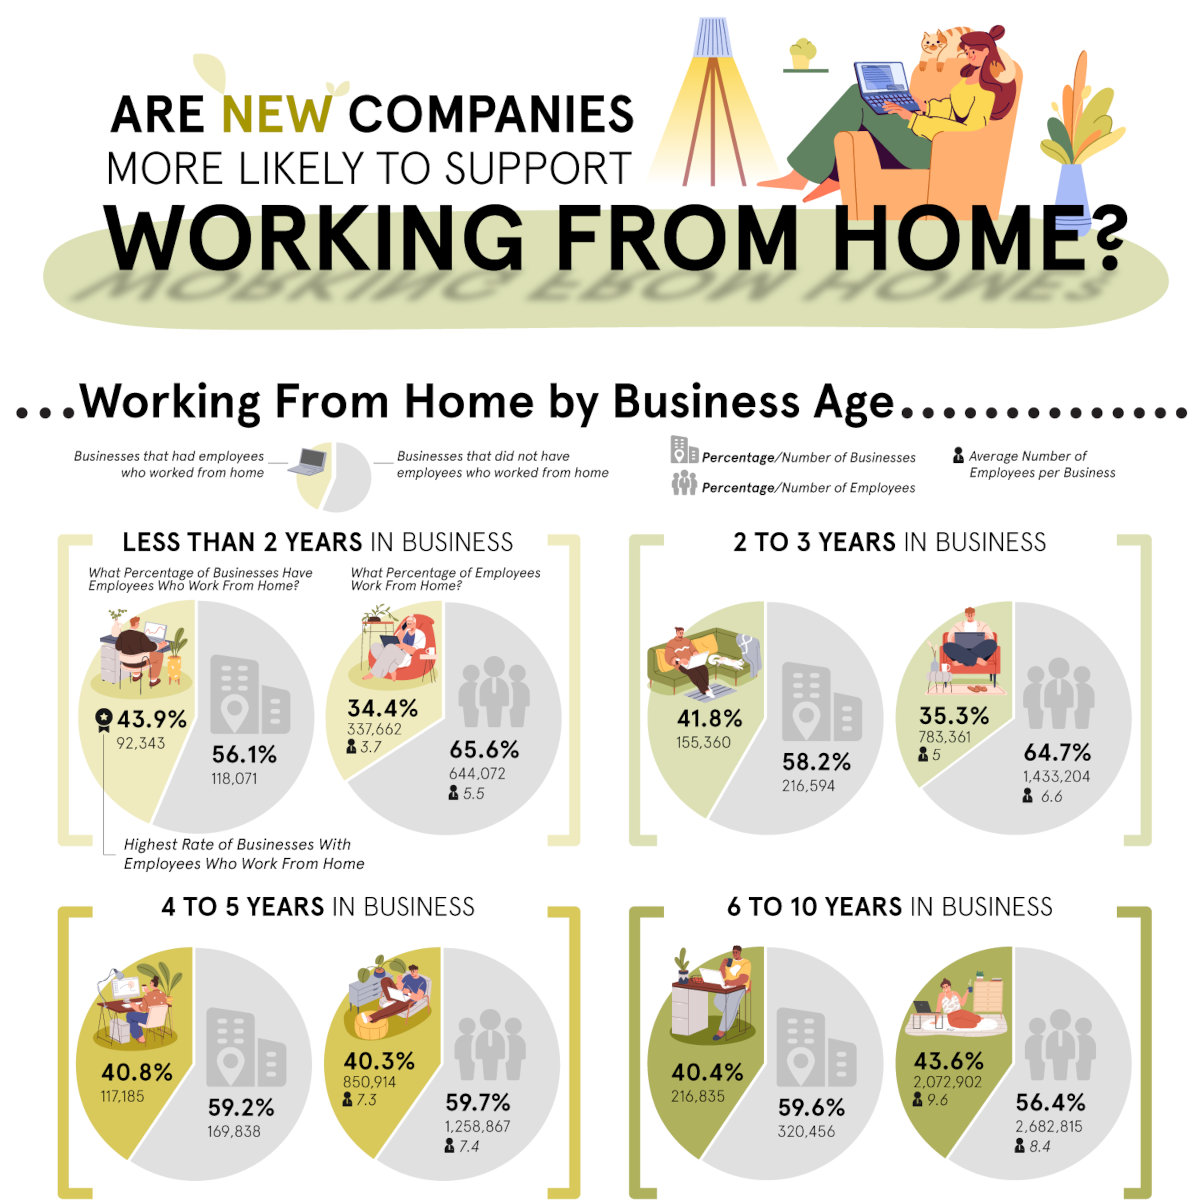
According to data from the U.S. Census Bureau’s 2022 Annual Business Survey, companies less than two years old lead the pack when supporting remote work — 43.9 percent of them report having remote employees, the highest share among all business age groups.
That said, the story changes when we shift the lens to look at businesses with more employees. The highest rate of remote work is found not at larger startups but at larger companies with 16 or more years in business. These legacy businesses employ more than 38 million remote workers, making up more than 76 percent of the remote-eligible workforce.
It seems that while younger businesses have an easier time setting up the infrastructure for remote work, larger companies are willing to eat the cost of transitioning. In other words, even though fewer older companies allow remote work proportionally, those that do tend to be much larger companies.
What factors affect whether employees can work from home?
According to the survey data, the biggest reason businesses across all age groups don’t offer remote work is simple: The job can’t be done from home. That factor alone accounts for 57 percent to 69 percent of responses, with older companies being more likely to cite this explanation.
Other barriers include the cost and complexity of managing remote employees and IT security issues. Interestingly, newer companies are less likely to be worried about these hurdles. For example, only 3.3 percent of businesses less than two years old cite management complexity as a barrier, compared to 5.3 percent of the oldest group. Security concerns show a similar pattern, suggesting that younger businesses may be more reliant on modern, cloud-based solutions.
At the same time, nearly 40 percent of the youngest businesses report no limiting factors to remote work. This may suggest that younger companies are either popping up specifically because of the availability of remote work or are having an easier time building their business around it.
So are new companies more likely to allow employees to work remotely from home? The data seems to say yes, in general. In terms of business count, those in operation for less than two years have the highest rate of supporting remote employees. But in terms of raw headcount, the giants with 16 or more years under their belts have the most remote workers overall.
What’s clear is that remote work isn’t going anywhere. It’s reshaping hiring practices, communications infrastructure and even real estate planning. Businesses, both young and old, are looking for new ways to get work done, regardless of where or when.
At Ooma, we help companies find those solutions with confidence. Whether you’re a startup writing your first employee handbook or an enterprise modernizing your tech stack, our communication solutions support great work from home, hybrid and in-office teams.
Working from home data by business age
Less than two years in business
| Number of businesses | Percentage of businesses | Number of employees | Percentage of employees | Average number of employees per business | |
| Businesses that had employees who worked from home | 92,343 | 43.9% | 337,662 | 34.4% | 3.7 |
| Businesses that did not have employees who worked from home | 118,071 | 56.1% | 644,072 | 65.6% | 5.5 |
Two to three years in business
| Number of businesses | Percentage of businesses | Number of employees | Percentage of employees | Average number of employees per business | |
| Businesses that had employees who worked from home | 155,360 | 41.8% | 783,361 | 35.3% | 5.0 |
| Businesses that did not have employees who worked from home | 216,594 | 58.2% | 1,433,204 | 64.7% | 6.6 |
Four to five years in business
| Number of businesses | Percentage of businesses | Number of employees | Percentage of employees | Average number of employees per business | |
| Businesses that had employees who worked from home | 117,185 | 40.8% | 850,914 | 40.3% | 7.3 |
| Businesses that did not have employees who worked from home | 169,838 | 59.2% | 1,258,867 | 59.7% | 7.4 |
Six to 10 years in business
| Number of businesses | Percentage of businesses | Number of employees | Percentage of employees | Average number of employees per business | |
| Businesses that had employees who worked from home | 216,835 | 40.4% | 2,072,902 | 43.6% | 9.6 |
| Businesses that did not have employees who worked from home | 320,456 | 59.6% | 2,682,815 | 56.4% | 8.4 |
Eleven to 15 years in business
| Number of businesses | Percentage of businesses | Number of employees | Percentage of employees | Average number of employees per business | |
| Businesses that had employees who worked from home | 155,016 | 38.2% | 2,048,635 | 47.3% | 13.2 |
| Businesses that did not have employees who worked from home | 250,492 | 61.8% | 2,280,942 | 52.7% | 9.1 |
Sixteen or more years in business
| Number of businesses | Percentage of businesses | Number of employees | Percentage of employees | Average number of employees per business | |
| Businesses that had employees who worked from home | 410,850 | 35.6% | 38,070,259 | 76.4% | 92.7 |
| Businesses that did not have employees who worked from home | 741,745 | 64.4% | 11,790,965 | 23.6% | 15.9 |
What factors affect working from home?
|
| Less than 2 years in business | 2 to 3 years in business | 4 to 5 years in business | 6 to 10 years in business | 11 to 15 years in business | 16 or more years in business |
| Job or parts of job cannot be performed at home | 56.8% | 62% | 61.9% | 63.2% | 64.3% | 69.1% |
| Management of employees is too costly or complicated | 3.3% | 3.6% | 3.9% | 4.3% | 4% | 5.3% |
| Security (IT or other) concerns | 3.5% | 3.9% | 3.8% | 5% | 5.1% | 6.3% |
| Other reasons | 2.5% | 2.6% | 2.7% | 2.6% | 2.5% | 2.5% |
| No limiting factors | 39.7% | 34.6% | 34.5% | 33.1% | 32.2% | 27.6% |
How many businesses responded to the Annual Business Survey, based on years in business?
Less than two years in business
- Total number of businesses in U.S.: 867,040
- Number of businesses that responded to survey: 210,413
- Percentage of total businesses that responded to survey: 24.27%
Two to three years in business
- Total number of businesses in U.S.: 769,902
- Number of businesses that responded to survey: 371,953
- Percentage of total businesses that responded to survey: 48.31%
Four to five years in business
- Total number of businesses in U.S.: 582,449
- Number of businesses that responded to survey: 287,022
- Percentage of total businesses that responded to survey: 49.28%
Six to 10 years in business
- Total number of businesses in U.S.: 1,017,756
- Number of businesses that responded to survey: 537,290
- Percentage of total businesses that responded to survey: 52.79%
Eleven to 15 years in business
- Total number of businesses: 715,279
- Number of businesses that responded to survey: 405,509
- Percentage of total businesses that responded to survey: 56.69%
Sixteen or more years in business
- Total number of businesses: 1,940,998
- Number of businesses that responded to survey: 1,152,594
- Percentage of total businesses that responded to survey: 59.38%
Source
U.S. Census Bureau 2022 Annual Business Survey (ABS) – Characteristics of Businesses
https://www.census.gov/data/tables/2022/econ/abs/2022-abs-characteristics-of-businesses.html
Husain Sumra is a former journalist who reported on the biggest companies in tech, from Apple to Amazon, covering cloud services, consumer technology and communication solutions. His journalism background has helped him bring a customer-first approach to content marketing, creating pieces of content aimed at helping people.